
QR Code Tracking 101: Every Number You'll See, Explained
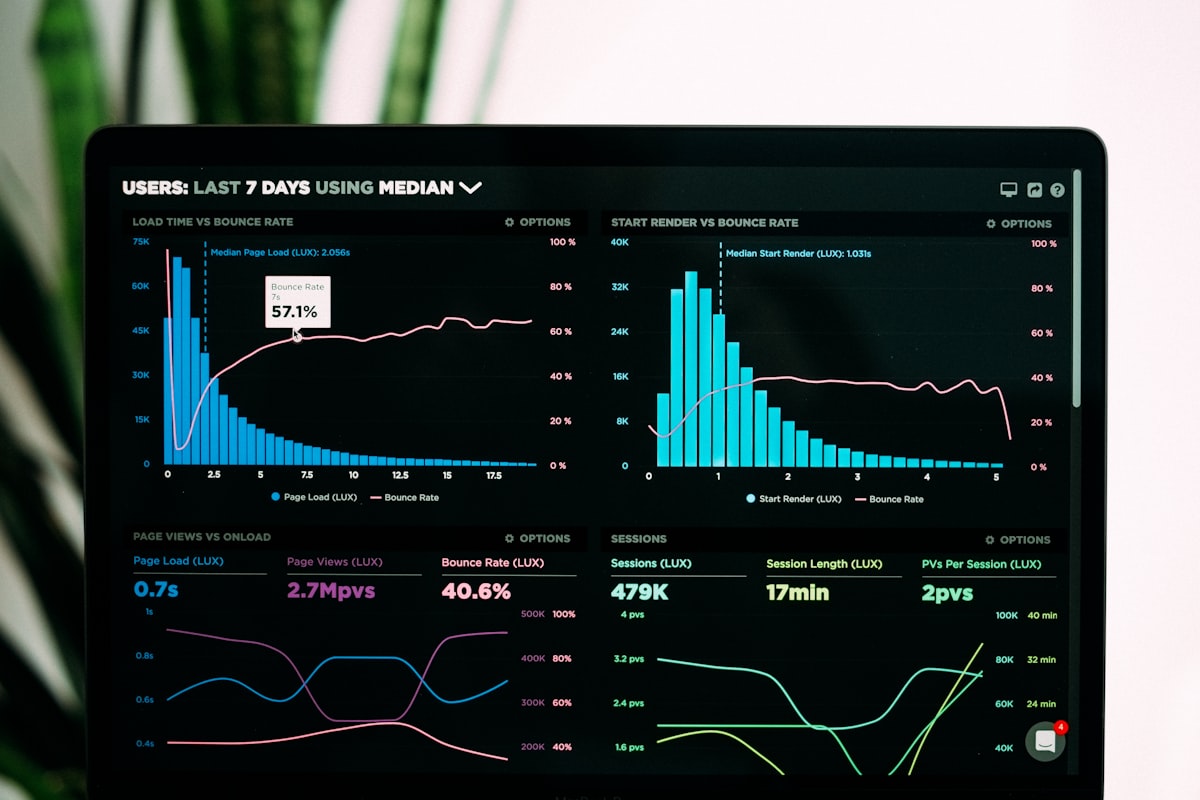
Tracking a QR code is just as nuanced as tracking a website. Here's a plain-English guide to every metric your dashboard will show, what it actually measures, and which ones to ignore.
Total Scans vs Unique Scans
Total scans is every single scan event, including the same person scanning four times to test it. Inflated by curiosity scans, debugging, and people trying to take a screenshot of the page after.
Unique scans is rough, on every platform. Nobody can identify a scanner — there's no login and no cookie on the other side — so every tool groups scans by whatever signature it has and calls the result "unique". On CreateQRCodes that grouping is by device signature across the range you're viewing: two people on the same phone model can collapse into one, and one person using two browsers can count as two. Treat it as an estimate of reach, not a headcount.
Scans by Day
Worth more than people think. If your code is on a tradeshow banner, you should see Tuesday-to-Thursday spikes across the conference. If you don't see the pattern you expected, your placement isn't being noticed. CreateQRCodes charts this as a day-by-day timeline you can filter to 7, 30 or 90 days; every scan also carries its exact timestamp, so if you want hour-of-day analysis, export the CSV and pivot it there.
Scans by Location
Derived from the network, not GPS — no QR tool asks the scanner for location permission. CreateQRCodes reports it at country level; some tools claim city or region, which is a guess from an IP database and is wrong often enough that you shouldn't plan around it. Country is useful for confirming the right audience is finding you (menu printed in Italy, scans coming from Italy — good). It is useless for "did this exact placement work?" — for that, use a distinct code per placement.
Scans by Device / OS
iOS vs Android matters because your landing page experience may differ. Heavy iOS skew on a code in a working-class neighborhood is a clue that demographics aren't matching expectations. Useful for landing-page optimization more than for QR strategy.
Scan-to-Conversion
The metric that actually matters and the one most QR dashboards don't show natively. You'll need to:
- Add a UTM-tagged URL as the QR's destination so Google Analytics or PostHog tracks it as a distinct source
- Define a conversion event on the destination page (signup, purchase, click)
- Compute scan-to-conversion = (conversions from QR source ÷ unique scans on that QR)
A 5% scan-to-conversion is good for most B2C use cases. Below 2%, your landing page is probably the problem, not the QR.
The metric that doesn't matter (but everyone obsesses over)
Total scan count, week over week. Especially for printed campaigns, scan count drops over time as the novelty wears off, materials get torn down, and people who already scanned don't re-scan. A declining total-scans line isn't a campaign failing — it's a campaign aging normally. What matters is whether scans-per-thousand-impressions stays steady when you re-print.
How to instrument it correctly
- Use a distinct dynamic QR code per placement. One code per flyer batch, one per location, one per channel. Otherwise you can't tell which placement worked.
- Use UTM parameters on the destination URL (
?utm_source=flyer-batch-3&utm_medium=qr&utm_campaign=spring-sale) so your downstream analytics inherits the source. - Don't use a URL shortener as the QR's destination. Adds an extra hop, can break referrer data, and one provider going down kills two layers instead of one.